24 agosto, 2026 | by Edwin Mendivil Barceló
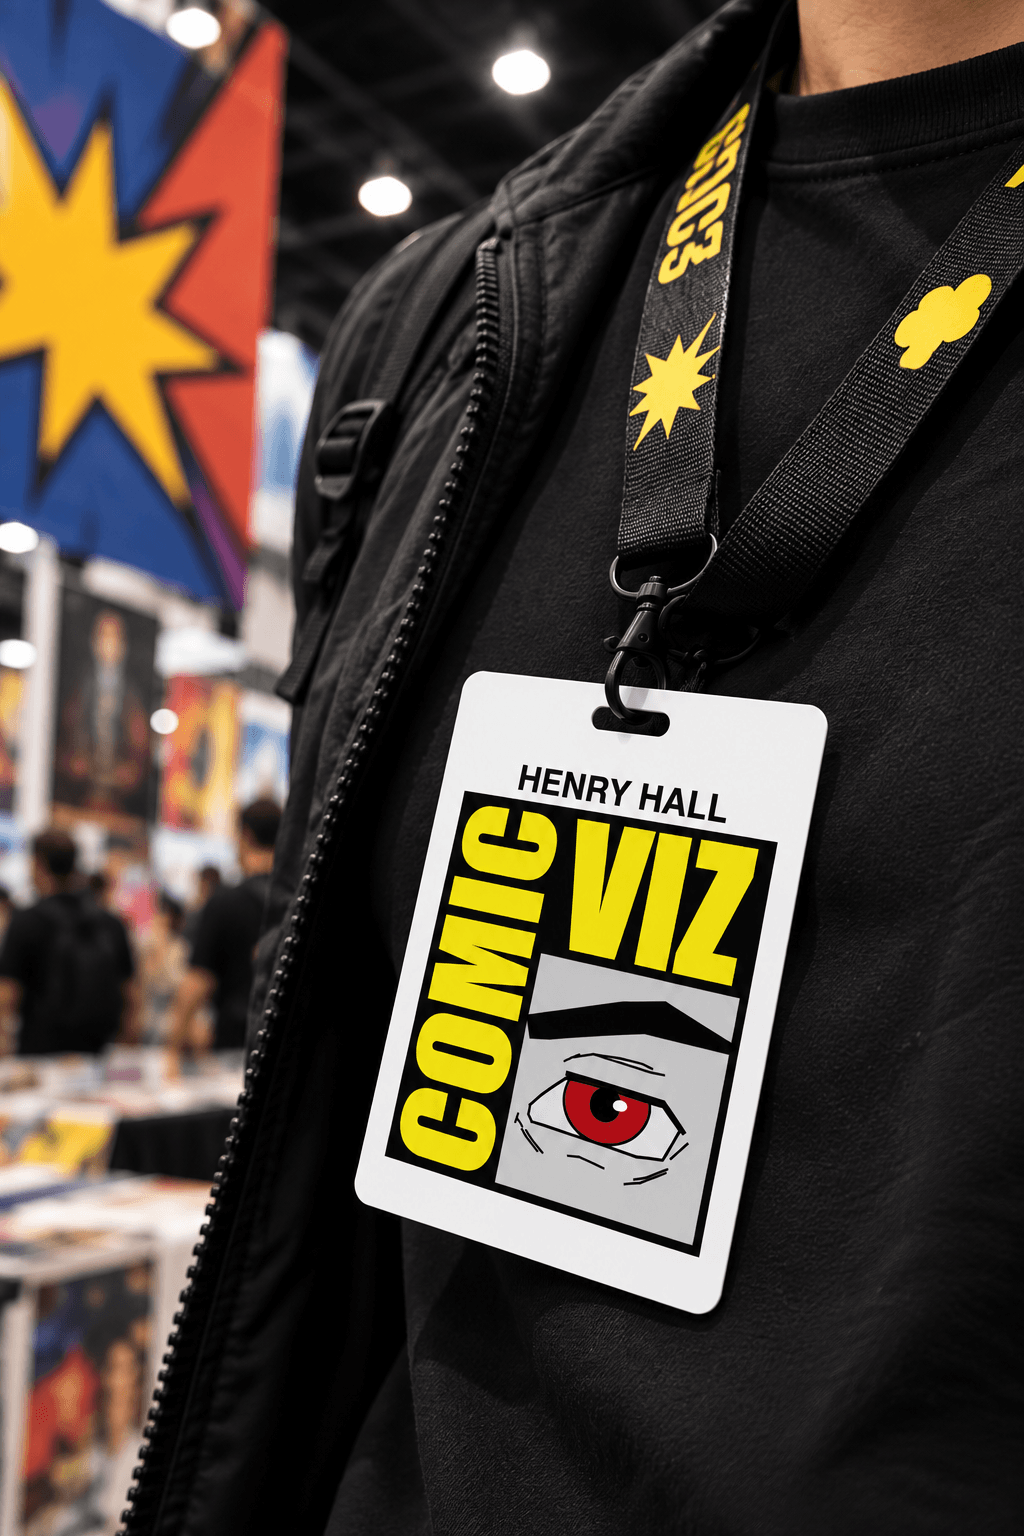
A Data Art and Data Badge project that recreates the Comic Con logo as a custom chart utilizing data from Marvel and DC characters.
TYPE: Data Art | TOOLS: R, Javascript (P5.js) | CLIENT: Personal | YEAR: 2024
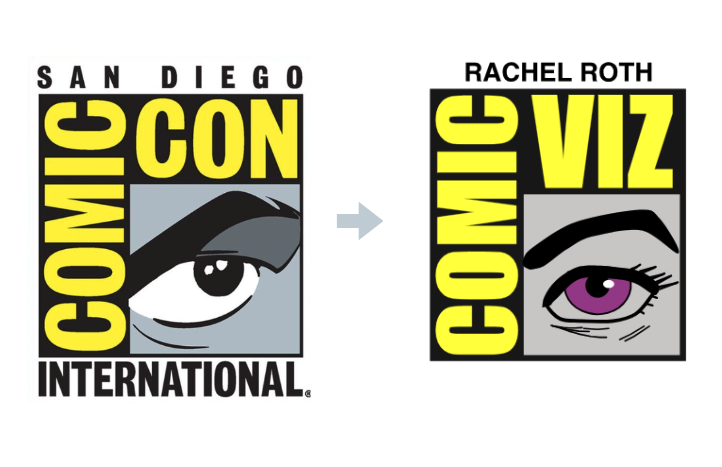
I had previously worked with data about superheroes. The dataset contains data on eye color for Marvel and DC Characters. So it came to my mind the Comic Con Logo, which is basically a hero’s eye.
I wondered what if the Comic Con logo changed based on the eye color of the heroes. I got a Dataviz/Data Art project on my hands!
Since this project is merely a concept, I couldn’t replicate the logo exactly, including the eyedrawing and typography. Therefore, I searched the internet for a similiar hero’s eye (for both men and women) and a font for the text.
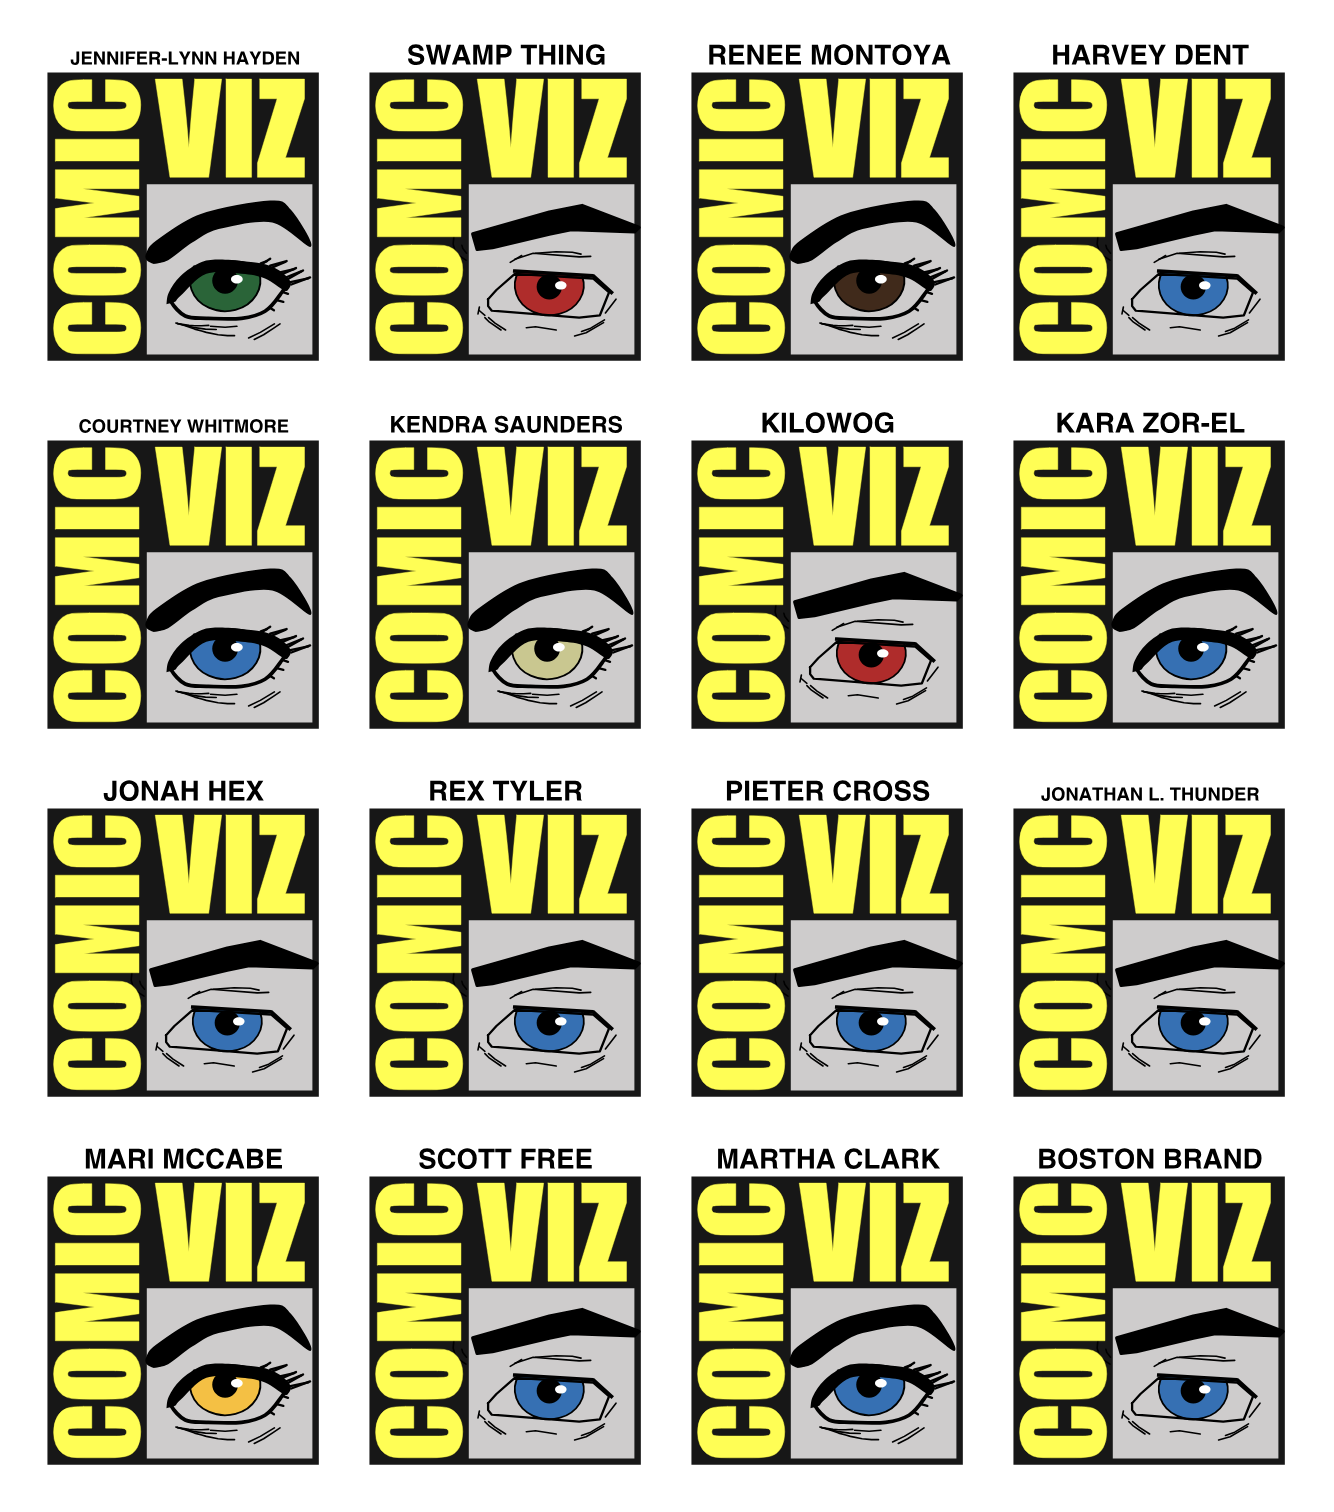
So, the result is a grid of custom charts of every superhero.
Think of it as a way for brands to blend their logo with some cool data. Imagine if at Comic Con, everyone got a random data badge that included the name and eye color of one of the thousand characters from Marvel and DC Comics. That’s basically what Comic Viz is all about!.


Edwin Mendivil Barceló
@vizualdatos

Convierto información compleja en historias visuales interactivas a través del análisis de datos, el diseño y la programación.
Power BI | Tableau | Rstats | Javascript
Dashboards Efectivos | Scrollytelling | Arte Con Datos