20 agosto, 2026 | by Edwin Mendivil Barceló
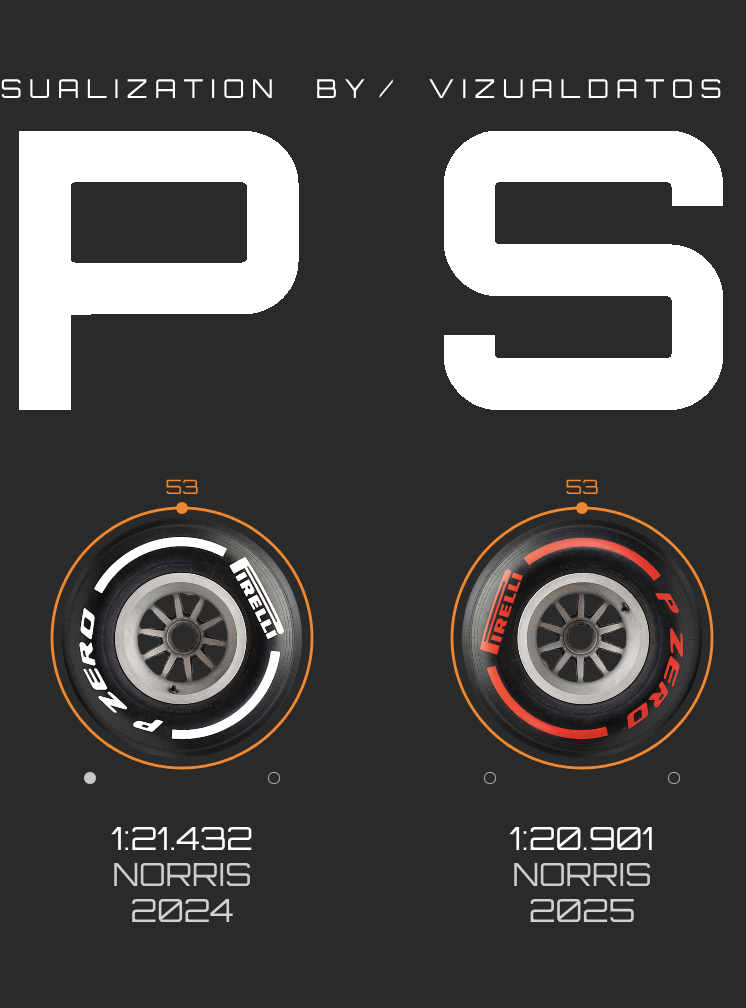
A Custom Visualization coded in p5.js to display Monza F1 Fastest Laps per year. 8 variables were represented: lap number, lap time (rotational movement as a preattentive attribute), pole position, race winner, team, driver, year and tire compound.
TYPE: Data Visualization | TOOLS: R, P5.js | LINK: Monza F1 Fastest Laps | CLIENT: Personal | YEAR: 2025
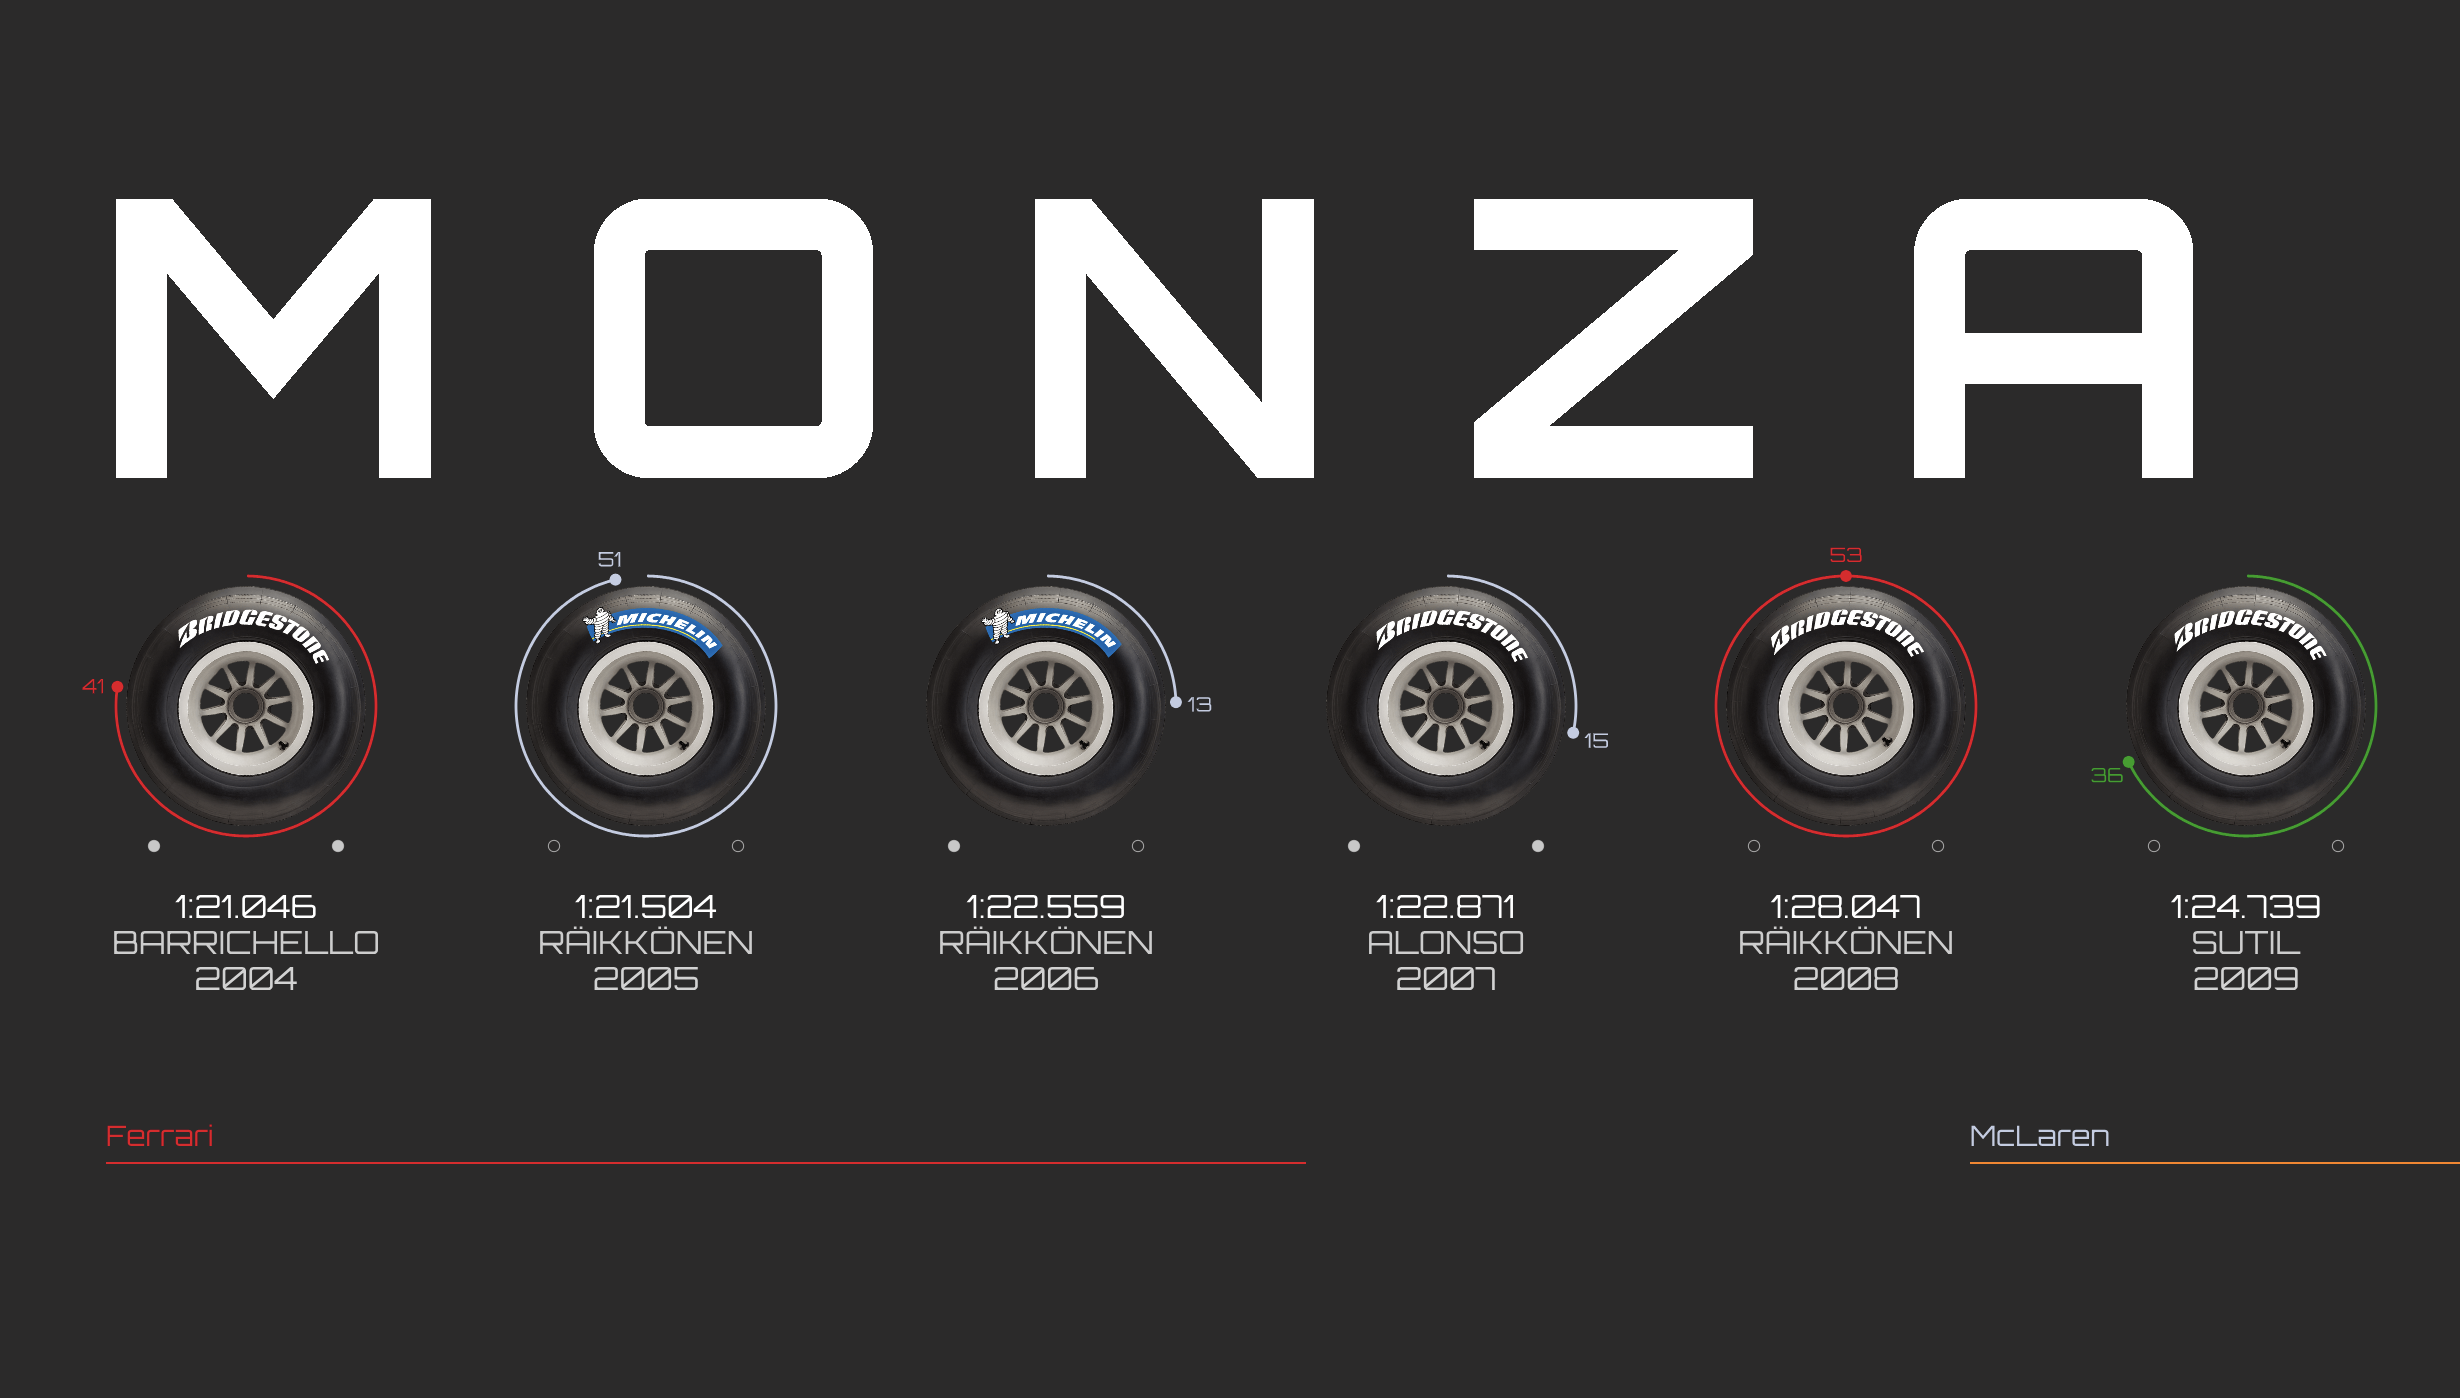
A Data Visualization coded in javascript (p5.js). 8 variables are represented:
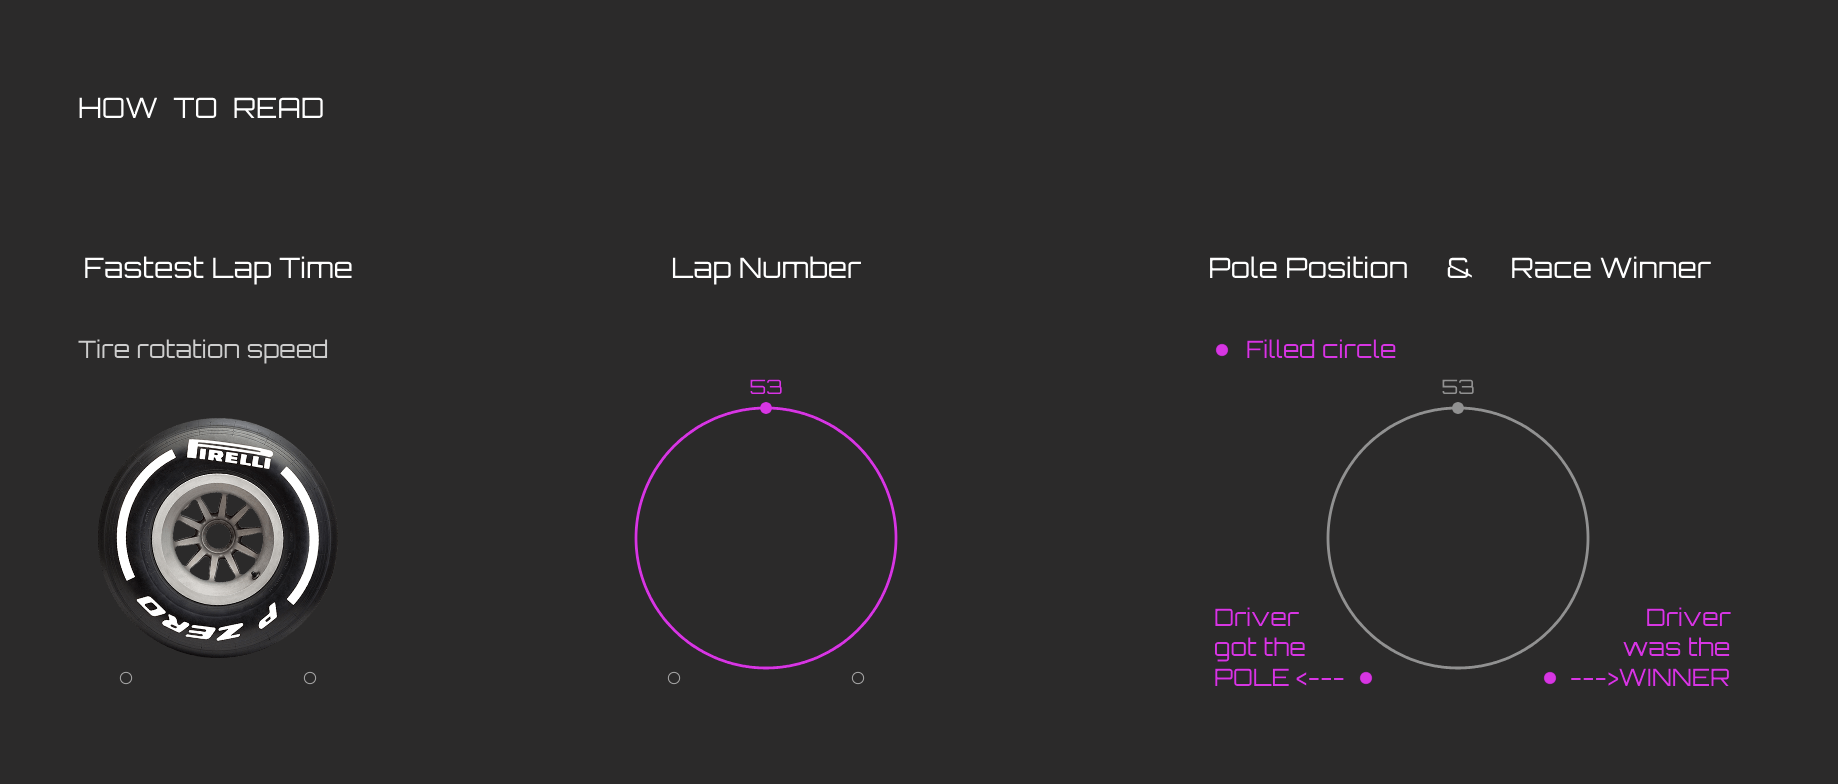
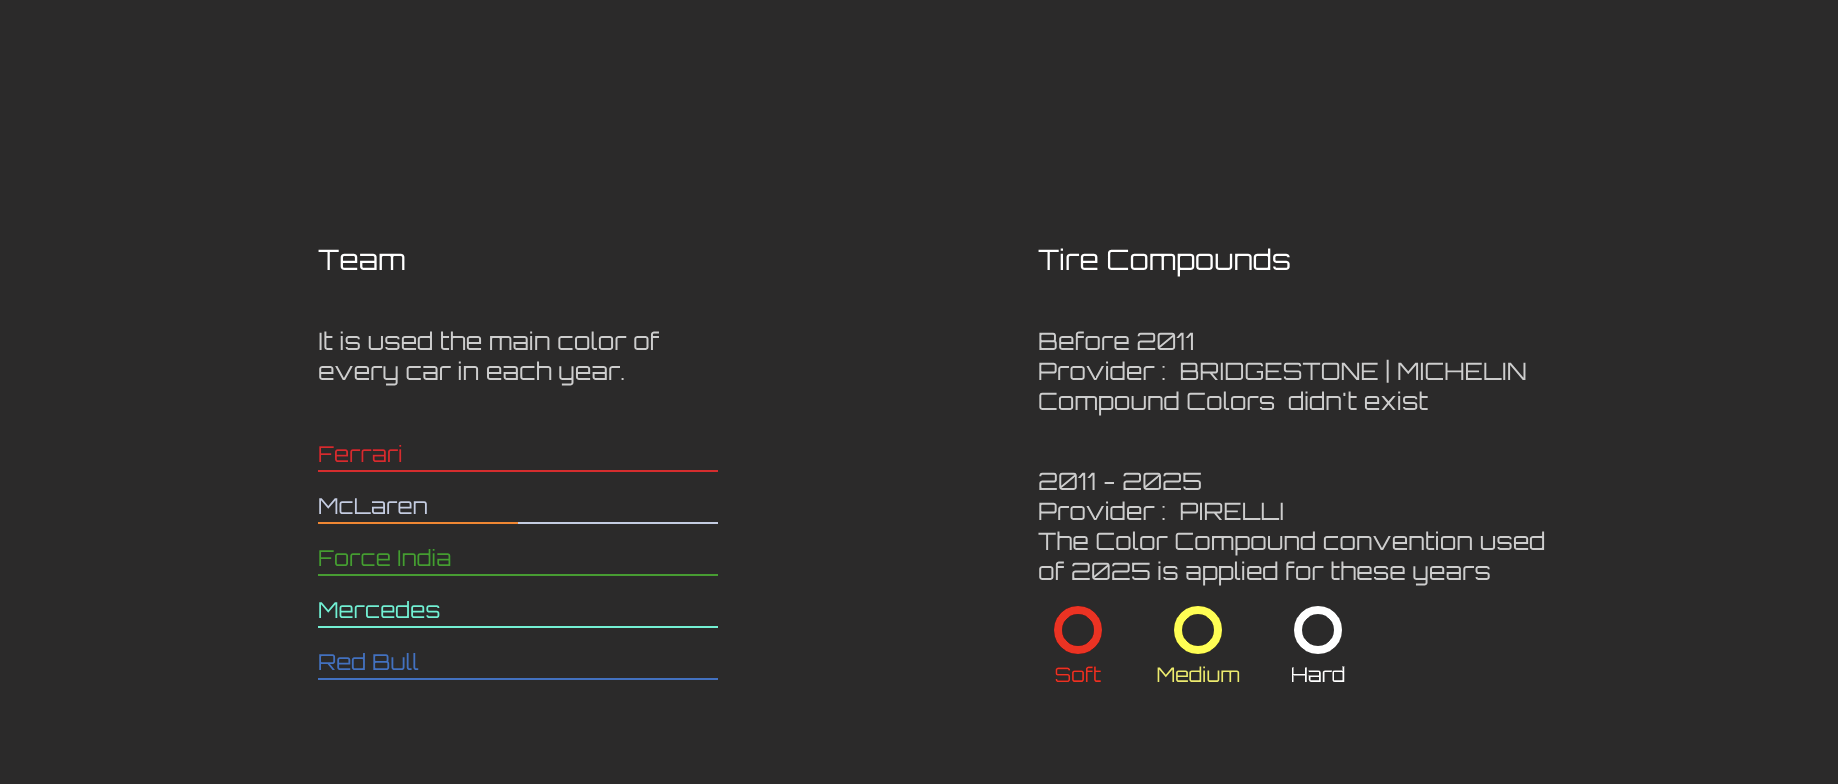
I wanted to use/experiment (kinda…) the movement as a Preattentive Attribute. That’s why this variable was intentional given greater visual prominence. The rotational movement of the tires was slowed down to observe the difference in speed over the years.
The visualization can be explored to answer these questions:

Edwin Mendivil Barceló
@vizualdatos

Convierto información compleja en historias visuales interactivas a través del análisis de datos, el diseño y la programación.
Power BI | Tableau | Rstats | Javascript
Dashboards Efectivos | Scrollytelling | Arte Con Datos