24 agosto, 2026 | by Edwin Mendivil Barceló
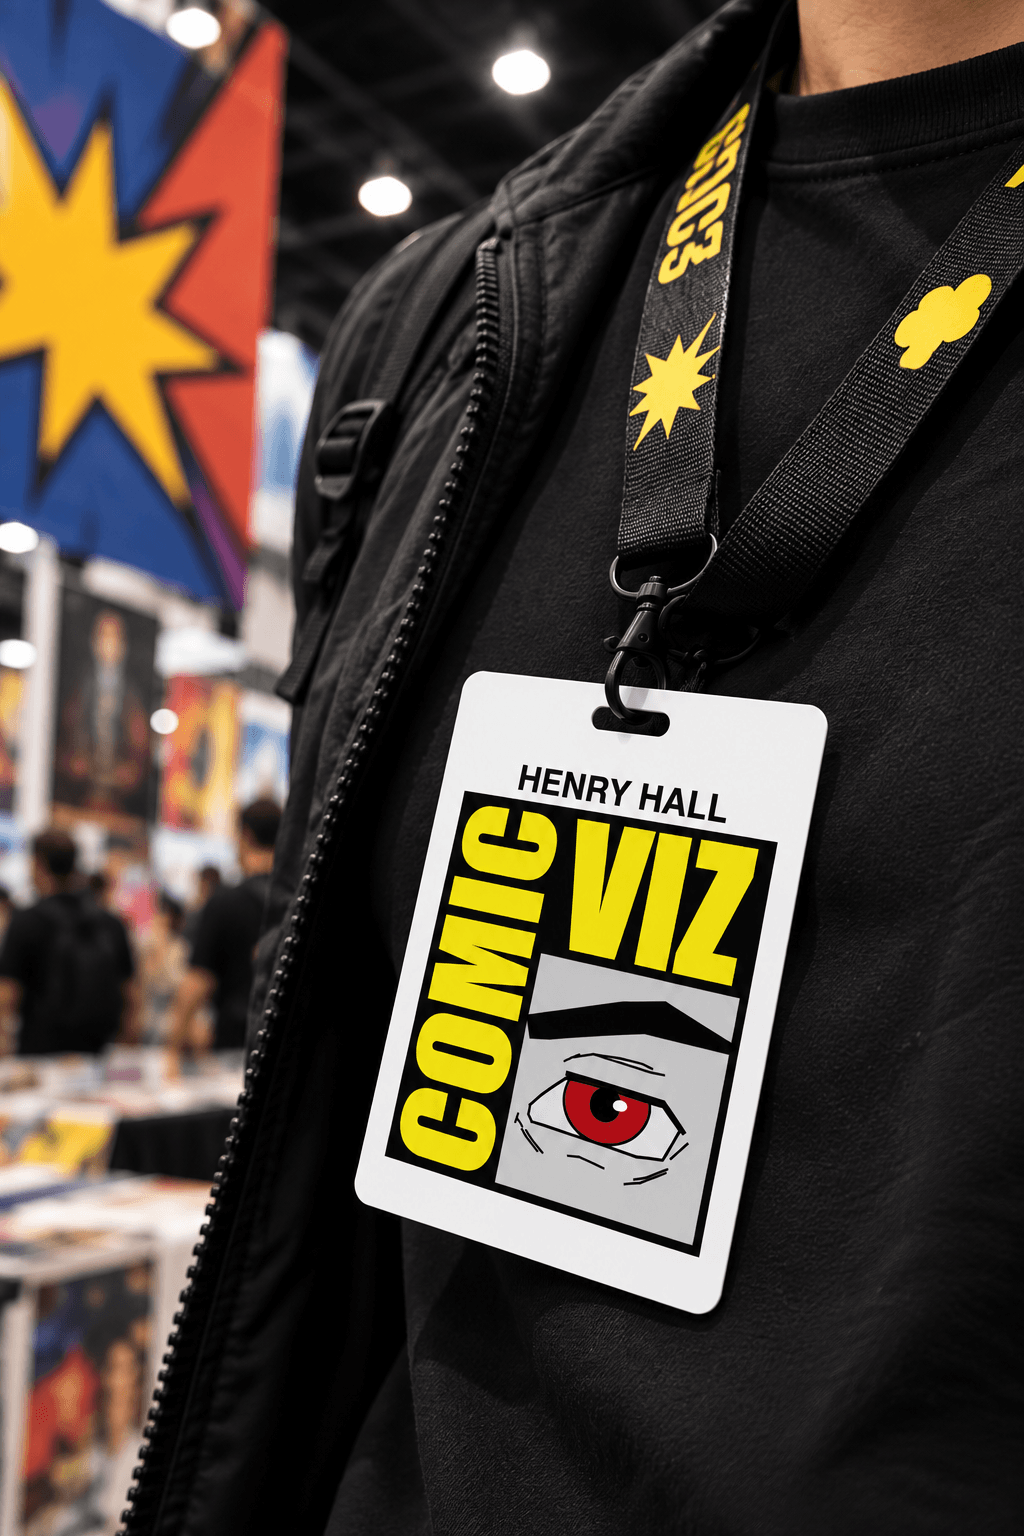
A Data Art project that recreates the Comic Con logo as a Custom Chart using Marvel and DC characters data. It might be named as a Brand Data Visualization Badge/Product
TYPE: Data Art | TOOLS: R, Javascript (P5.js) | CLIENT: Personal | YEAR: 2024
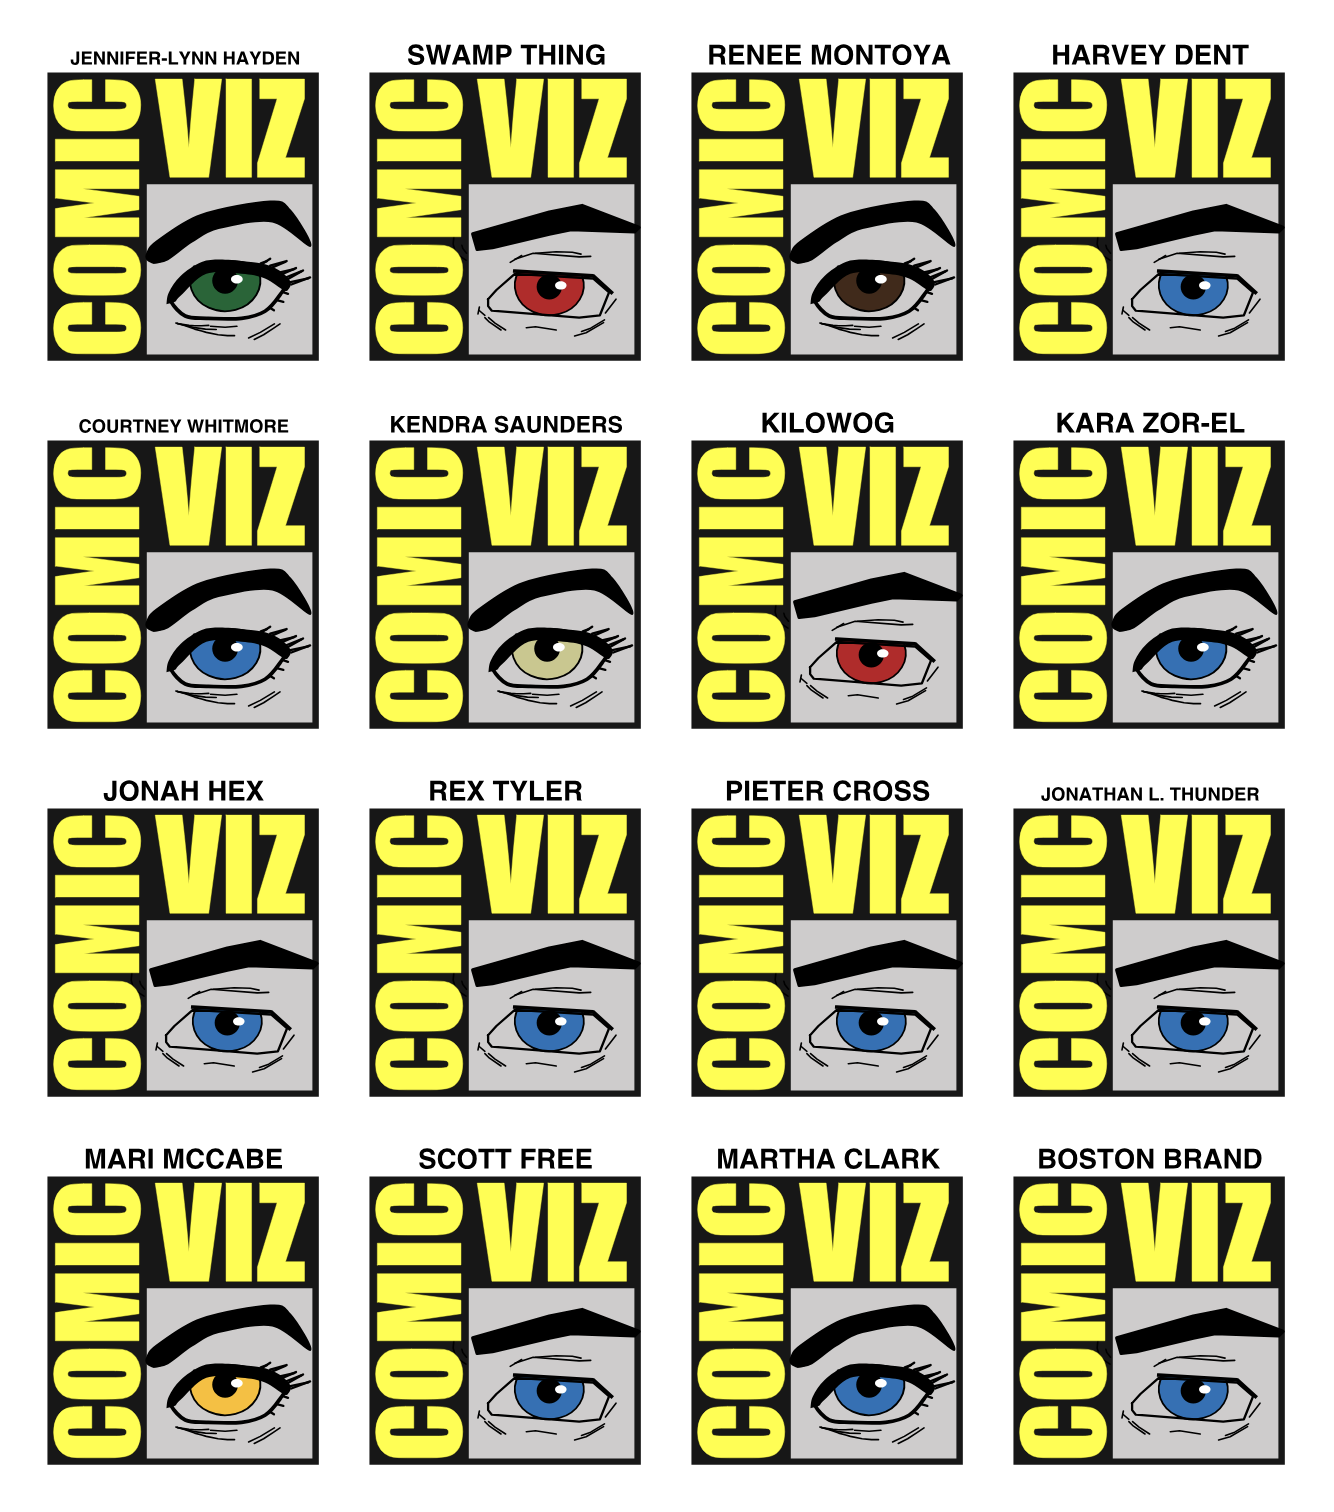
I had already worked previously with data about heroes. So it came to my mind the Comic Con Logo, which is basically a hero’s eye. The dataset contains data of eye color for Marvel and DC Characters.
I asked myself What if the Comic Con Logo changes based on the eye color of the heroes?. I got a Dataviz/Data Art project on my hands.
As this project is just a concept, I couldn’t replicate the logo exactly, same eye drawing, tipography?, not allowed!. So I looked for on internet a similiar heroe’s eye (for men and women) and font for the text.
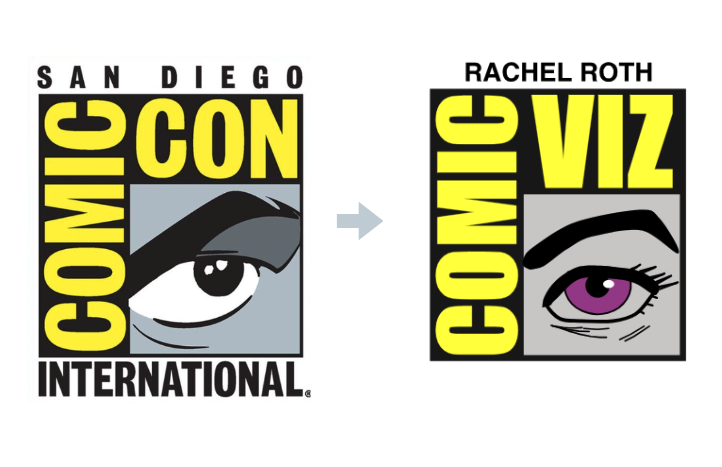
So the outcome is a grid of custom charts with the, name, eye color and the drawing indicates the sex of the character.
It is a concept that can be used by brands, mixing or changing an element of the logo with data. What if in the Comic Con, every participant get a random data badge that comes with the name and eye color of one of the thousand charactes of Marvel and DC Comics?. Yeah that is Comic Viz about


Edwin Mendivil Barceló
@vizualdatos

Convierto información compleja en historias visuales interactivas a través del análisis de datos, el diseño y la programación.
Power BI | Tableau | Rstats | Javascript
Dashboards Efectivos | Scrollytelling | Arte Con Datos